
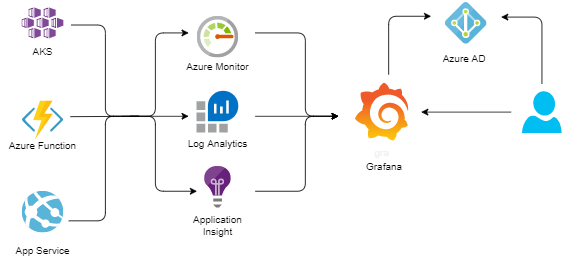
In my current project, the most of the workload is running on Azure (Azure Kubernetes Service, Azure Functions and Azure App Services) and we use Azure Monitor, Azure Log Analytics and Application Insight to collect and analyse our logs and metrics. However, for the metrics visualization and alerts we use Grafana.
Grafana terminology
Let’s start by introducing some of the terms used in Grafana.
Data source
Grafana supports many different storage back-ends for your time series data (data-source). Each data-source has a specific Query Editor that is customized for the features and capabilities that the particular data-source exposes.
It is not a surprise that Azure Monitor is one of the supported data-sources.
Azure Monitor data-source
The Grafana Azure Monitor data-source supports the following services:
- Azure Monitor - the platform service that provides a single source for monitoring Azure resources.
- Application Insights - an extensible Application Performance Management (APM) service for web developers on multiple platforms.
- Azure Log Analytics - a service that gives you access to log data collected by Azure Monitor.
Dashboard
A dashboard is a set of one or more panels organized and arranged into one or more rows. Grafana ships with a variety of Panels. Each panel can interact with data from any configured Grafana Data Source. Dashboards can be tagged.
Alert
Alerts allow you to identify problems in your system moments after they occur. By quickly identifying unintended changes in your system, you can minimize disruptions to your services.
Users and Teams
Users are named accounts in Grafana that can be granted permissions to access resources throughout Grafana.
Teams allow you to grant permissions for a group of users.
Teams structure
There are several independent autonomous teams and they use different Azure Monitor services to collect logs and metrics from applications and services owned by these teams. Azure Monitor services are deployed to different resource groups at different subscriptions.
At the same time, all teams use the same Grafana instance. To visualize their data, teams need to configure their own Grafana data-sources, connected to the teams’ Azure Monitor services. With data-sources in place, teams can create dashboards and alerts using their data-sources.
How should we organize Grafana resources in such a multi-team environment?
Structuring Grafana resources
Here are some of our conventions:
- Grafana instance is deployed and running inside AKS cluster.
- We use Azure AD integration for Grafana. That means that users have to use their Azure AD accounts to login to Grafana. I will cover how to enable Azure AD integration for Grafana instance running in AKS in one of the later posts.
- Users are assigned to one (or several) Grafana Teams. The same name is used for Grafana Team and Azure AD team.
- Each team has its own Dashboard folder with the same name as the Team name.
- We use Access Control List (ACL) model to limit access to dashboard folder.
- We use dashboard
tagsto link dashboards to the teams.
Deployment of Grafana resources owned by the teams
For dashboards, we are currently evaluating grafonnet. The idea is that teams implement Grafana dashboard as code and deploy them to Grafana with CI/CD pipelines.
When it comes to data-source provisioning, there are 3 ways you can deploy data-source in Grafana:
- Click-ops via Grafana UI
- Use Data source API
- Configure the data-source with provisioning
Options 1 is not an option at all, it’s a good way to learn and “play around”, but can’t be used for automation. Option 3 allows you to provision dashboards during Grafana deployment and this is good option for post provisioning configuration. But in our case, teams should be able to configure and deploy their data-sources themselves at any time. Therefore we decided to go for a declarative approach. That means that teams will configure their data-sources as json files, create a PR to the Grafana resources repository, and when PR is approved and merged, data-sources will be automatically deployed to Grafana using Azure DevOps CI/CD pipelines.
Azure monitor data-source configuration
Let’s check what it takes to configure Azure Monitor data-source. Azure Monitor data-source can access metrics from different services and each service can be configured individually.
Azure Monitor service
For Azure Monitor service, you need 4 pieces of information from Azure:
- Azure AD
Tenant id - Azure AD application
Client Id - Azure AD application
Client Secret - Default Subscription Id
Azure Log Analytics service
For Azure Log Analytics service, you need to provide the following configuration values:
- Azure AD
Tenant id - Azure AD application
Client Id - Azure AD application
Client Secret - Default
Subscription Id - Default
Workspace
If you use both Azure Monitor Service and Log analytics Service at the same data-source and if Azure Monitor and Log Analytics are at the same subscription, you can use the same data-source configuration for Azure Monitor and Log Analytics services.
Application Insights
For Application Insights you need two pieces of information:
- Application Insights
Application ID - Application Insights
API Key
You can configure different combination of services at the same data-source. It may contain all three services, two of them or just one service.
Sensitive information
We want to use json files for data-source configuration and store them to git repository, and we definitely don’t want to hard-code sensitive information, like Azure AD Application Client secret or Application Insights API key.
We store sensitive information at Azure Key Vault, and since our teams use different Azure subscriptions for their resources, this sensitive pieces of data-source configuration will be distributed within different key-vaults, owned by the teams.
For instance, if a team wants to add data-source for Application Insights service, they need to specify AppInsights Application ID and API Key. Since API Key is a sensitive information, it will be stored at one of the team’s key-vaults and team will provide the following information about the key-vault inside data-source configuration:
- key-vault name
- key-vault resource group name
- key-vault subscription id
- key-vault secret name
If we “transform” this information to json, it will look like this:
...
"apiKey": {
    "keyvault": {
        "name": "iac-foobar-infra-kv",
        "subscriptionId": "00000000-0000-0000-0000-000000000000",
        "resourceGroupName": "iac-app-foobar-rg",
        "secretName": "appinsight-api-key"
    }
}
...
Configuration file
We decided to use one file per data-source type, and here is the complete configuration file structure for grafana-azure-monitor-datasource type:
{
    "name": "",
    "environment": "",
    "team": "",
    "type": "grafana-azure-monitor-datasource",
    "monitor": {
        "subscriptionId": "",
        "tenantId": "",
        "clientId": "",
        "clientSecret": {
            "keyvault": {
                "name": "",
                "subscriptionId": "",
                "resourceGroupName": "",
                "secretName": ""
            }
        }
    },
    "logAnalytics": {
        "subscriptionId": "",
        "tenantId": "",
        "workspace": "",
        "clientId": "",
        "clientSecret": {
            "keyvault": {
                "name": "",
                "subscriptionId": "",
                "resourceGroupName": "",
                "secretName": ""
            }
        }
    },
    "appInsights": {
        "applicationId": "",
        "apiKey": {
            "keyvault": {
                "name": "",
                "subscriptionId": "",
                "resourceGroupName": "",
                "secretName": ""
            }
        }
    }
}
name
the “logical” name of the data-source
environment
Teams may have different environments for their resources and each environment may have its own set of Azure Monitor, Log Analytics or Application Insights services. In this case, teams need to create a data-source for each environment and the actual name of the data-source in Grafana will be composed as: datasource-name-environment-ds.
team
name of the team owning data-source
type
as of now, we only use one data-source type, but eventually, we may have other type of data-source (for example, prometheus). For Azure Monitor data-source, the type is set to grafana-azure-monitor-datasource.
monitor
If a team uses Azure Monitor service, they need to add monitor section and provide the following information:
- subscriptionId - Azure Monitor
Subscription Id - tenantId - Azure AD
Tenant Id - clientId - Azure AD
Application Id - clientSecret - reference to key-vault secret containing Azure AD Application secret
logAnalytics
If a team uses Log Analytics service, they need to add logAnalytics section and provide the following information:
- subscriptionId - Azure Monitor
Subscription Id - tenantId - Azure AD
Tenant Id - workspace - Log Analytics default workspace id
- clientId - Azure AD
Application Id - clientSecret - reference to key-vault secret containing Azure AD Application secret
appInsights
If a team uses Application Insights service, they need to add appInsights section and provide the following information:
- applicationId - Application Insights
Application Id - apiKey - reference to key-vault secret containing Application Insights
API Key
Provisioning script
In our case, we use bash with jq to work with json, az cli to get access to Azure resources (like key-vaults) and curl to call Grafana rest API, and here is what our provisioning script does:
- Reads input parameters
- Reads Grafana admin user password from the key-vault
- Reads json configuration from the data-source file
- Parses
name,typeandteaminformation - If data-source contains
monitorsection, parses it and extracts all configuration values. ReadsclientSecretproperty value from the specified key-vault. - If data-source contains
logAnalyticssection, parses it and extracts all configuration values. ReadsclientSecretproperty value from the specified key-vault. - If data-source contains
appInsightssection, parses it and extracts all configuration values. ReadsapiKeyproperty value from the specified key-vault. - Replaces all placeholders with actual values in datasource template file
- Checks if data-source already exists
- If it does, updates existing data-source using Grafana Rest API
- If it doesn’t, creates a new data-source using Grafana Rest API
Here are some fragments of the script:
...

function parseSecretValue() {
    secretSectionJson=$1
    secretValue=""
    keyvaultName=$(echo ${secretSectionJson} | jq -r .keyvault.name)
    keyvaultSubscriptionId=$(echo ${secretSectionJson} | jq -r .keyvault.subscriptionId)
    keyvaultResourceGroupName=$(echo ${secretSectionJson} | jq -r .keyvault.resourceGroupName)
    keyvaultSecretName=$(echo ${secretSectionJson} | jq -r .keyvault.secretName)
    echo -e "Reading ${keyvaultSecretName} secret from ${keyvaultName}(${keyvaultSubscriptionId})"
    secretValue=$(az keyvault secret show -n ${keyvaultSecretName} --vault-name ${keyvaultName} --subscription ${keyvaultSubscriptionId} --query value -o tsv)
}

echo -e "Reading data source configuration from ${datasourceFile} file"
json=$(jq -r '.' ${datasourceFile})

name=$(echo $json | jq -r .name)
team=$(echo $json | jq -r .team)
type=$(echo $json | jq -r .type)
environment=$(echo $json | jq -r .environment)

echo -e "Check if data source contains Monitor section"
if [[ $(echo $json | jq 'has("monitor")') == true ]]; then
    echo -e "Monitor section exists, parsing configuration"
    subscriptionId=$(echo ${json} | jq -r .monitor.subscriptionId)
    tenantId=$(echo ${json} | jq -r .monitor.tenantId)
    clientId=$(echo ${json} | jq -r .monitor.clientId)
    if [[ $(echo $json | jq .monitor | jq 'has("clientSecret")') = true ]]; then
        parseSecretValue "$(echo $json | jq .monitor.clientSecret)"
        clientSecret=${secretValue}
    else
        echo -e "No clientSecret information specified. Aborting..."
    fi
else
    echo -e "Monitor section isn't configured..."
    subscriptionId=""
    tenantId=""
    clientId=""
    clientSecret=""
fi

...

dataSourceName="${name}-${environment}-ds"
echo -e "Check if $dataSourceName already exists"
dataSourceId=$(curl -s -u admin:${adminPassword} \
        -X GET "$grafanaRestAPIUrl/api/datasources/name/${dataSourceName}" \
        -H 'content-type: application/json' \
        -H 'accept: application/json' | jq .id -r)
if [[ ${dataSourceId} == "null" ]]; then
    dataSourceId=0
fi

echo -e "Transforming azure-monitor-datasource-template.json to azure-monitor-datasource.json"
cat ./templates/azure-monitor-datasource-template.json | \
     sed -e 's|{dataSourceId}|'${dataSourceId}'|g' | \
     sed -e 's|{dataSourceName}|'"${dataSourceName}"'|g' | \
     sed -e 's|{clientId}|'"${clientId}"'|g' | \
     sed -e 's|{clientSecret}|'"${clientSecret}"'|g' | \
     sed -e 's|{subscriptionId}|'"${subscriptionId}"'|g' | \
     sed -e 's|{tenantId}|'"${tenantId}"'|g'  | \
     sed -e 's|{logAnalyticsDefaultWorkspace}|'"${logAnalyticsDefaultWorkspace}"'|g'  | \
     sed -e 's|{logAnalyticsClientId}|'"${logAnalyticsClientId}"'|g'  | \
     sed -e 's|{logAnalyticsClientSecret}|'"${logAnalyticsClientSecret}"'|g'  | \
     sed -e 's|{logAnalyticsSubscriptionId}|'"${logAnalyticsSubscriptionId}"'|g'  | \
     sed -e 's|{logAnalyticsTenantId}|'"${logAnalyticsTenantId}"'|g'  | \
     sed -e 's|{appInsightsAppId}|'"${appInsightsAppId}"'|g'  | \
     sed -e 's|{appInsightsApiKey}|'"${appInsightsApiKey}"'|g'  > "${dataSourceName}.json"

if [[ ${dataSourceId} == 0 ]]; then
    echo -e "Deploying new grafana Data Source ${dataSourceName} from ${dataSourceName}.json file using ${grafanaRestAPIUrl} rest API"
    dataSourceId=$(curl -s -u admin:${adminPassword} \
            -X POST "$grafanaRestAPIUrl/api/datasources" \
            -H 'content-type: application/json' \
            -H 'accept: application/json' \
            --data-binary "@${dataSourceName}.json" | jq .datasource.id -r)
else
    echo -e "Updating grafana Data Source ${dataSourceName}(${dataSourceId}) from ${dataSourceName}.json file using ${grafanaRestAPIUrl} rest API"
    dataSourceId=$(curl -s -u admin:${adminPassword} \
            -X PUT "$grafanaRestAPIUrl/api/datasources/${dataSourceId}" \
            -H 'content-type: application/json' \
            -H 'accept: application/json' \
            --data-binary "@${dataSourceName}.json" | jq .datasource.id -r)
fi
...
and here is the data-source template file
{
    "id": {dataSourceId},
    "name": "{dataSourceName}",
    "type": "grafana-azure-monitor-datasource",
    "access": "proxy",
    "isDefault": false,
    "basicAuth": false,
    "jsonData": {
        "clientId": "{clientId}",
        "cloudName": "azuremonitor",
        "subscriptionId": "{subscriptionId}",
        "tenantId": "{tenantId}",
        "azureLogAnalyticsSameAs": false,
        "logAnalyticsClientId": "{logAnalyticsClientId}",
        "logAnalyticsDefaultWorkspace": "{logAnalyticsDefaultWorkspace}",
        "logAnalyticsSubscriptionId": "{logAnalyticsSubscriptionId}",
        "logAnalyticsTenantId": "{logAnalyticsTenantId}",
        "appInsightsAppId": "{appInsightsAppId}"
    },
    "secureJsonData": {
        "clientSecret": "{clientSecret}",
        "logAnalyticsClientSecret": "{logAnalyticsClientSecret}",
        "appInsightsApiKey": "{appInsightsApiKey}"
    }
}
Example
My team uses Application Insights called iac-foobar-dev-ai deployed to iac-foobar-dev-rg. We use iac-foobar-dev-infra-kv for infrastructure related sensitive configuration.
If I want to create new data-source with Application Insights service to Grafana, I will need to find 2 Application Insights configuration elements:
- Application Insights
Application ID - Create new
API Key
Find Application Insights Application ID
You can find your Application Insights Application ID at the portal under API Access right menu item. Or you can use az cli to get this information.
az monitor app-insights component show --app iac-foobar-dev-ai -g iac-foobar-dev-rg --query appId -o tsv
Note, you may need to install application-insights az cli extension:
az extension add -n application-insights
Create API Key and store it to key-vault
You can create new API Key from the portal at the API Access page. And you can copy value and create new secret at the key-vault.
Or you can use az cli to both create new API key and store it in the key-vault:
apiKey=$(az monitor app-insights api-key create --app iac-foobar-dev-ai --api-key grafana-key -g iac-foobar-dev-rg --query apiKey --read-properties ReadTelemetry -o tsv)
az keyvault secret set -n appinsight-api-key --vault-name iac-foobar-dev-infra-kv --value ${apiKey}
With Application ID and API key in place, I need to create new foobar-dev.json file with the following content:
{
    "name": "foobar",
    "team": "dev",
    "type": "grafana-azure-monitor-datasource",
    "appInsights": {
        "applicationId": "your-application-id-value",
        "apiKey": {
            "keyvault": {
                "name": "iac-foobar-dev-infra-kv",
                "subscriptionId": "00000000-0000-0000-0000-000000000000",
                "resourceGroupName": "iac-foobar-dev-rg",
                "secretName": "appinsight-api-key"
            }
        }
    }
}
And then I can deploy my data-source to the test Grafana instance by executing the following script:
./deploy-azure-monitor-datasource.sh test foobar-dev.json
Useful links
- Grafana data-source provisioning
- Grafana Data-source API
- Grafana Azure Monitor data-source
- Grafana Alerts
- jq - a lightweight and flexible command-line JSON processor
With that - thanks for reading!